Permafrost machine learning
Using machine learning models to make high-resolution maps of permafrost extent
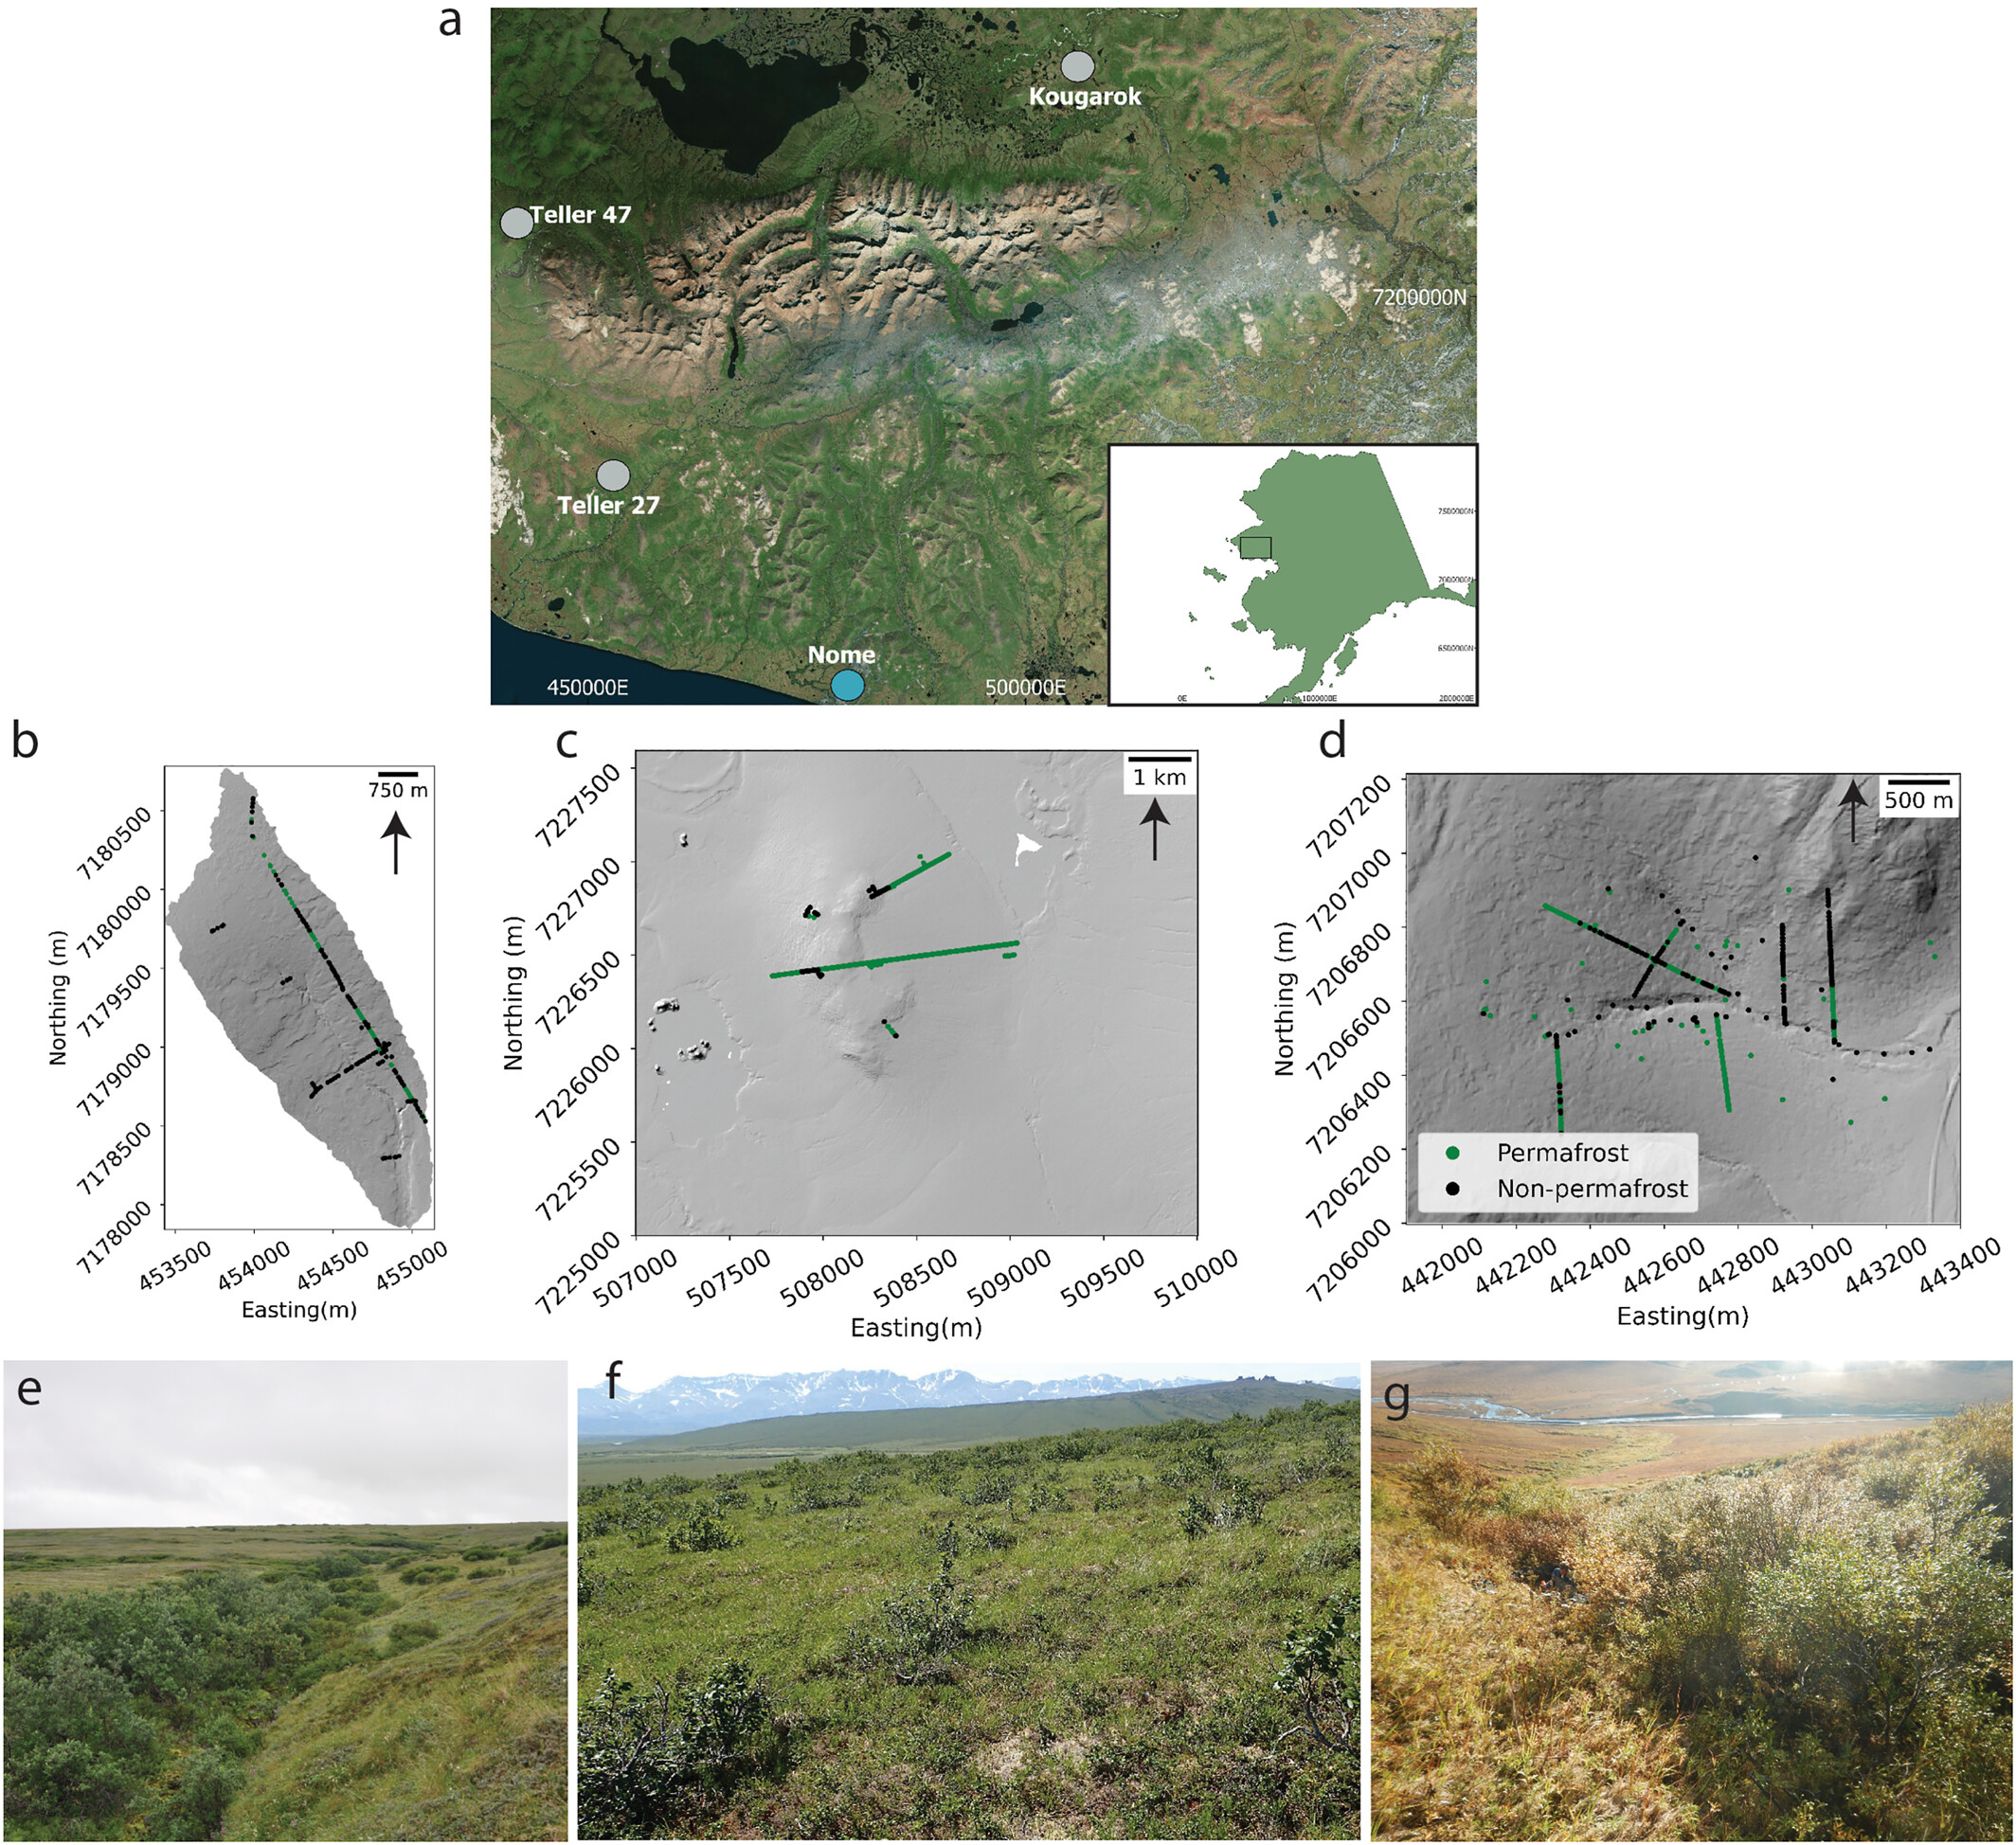
First of all, what is permafrost? Strictly, permafrost is any ground that is frozen for at least two consecutive years. In our work, we only consider the permafrost within the upper 120 cm of the ground surface, which we call "near-surface permafrost." We're interested in making high-resolution maps (<5 m spatial resolution) because 1) when permafrost thaws, the ground can sink rapidly and cause damage to nearby or overlying infrastructure, and 2) permafrost soils hold a ton of carbon which can be released during thaw, and we want to know how much of the landscape has already thawed.
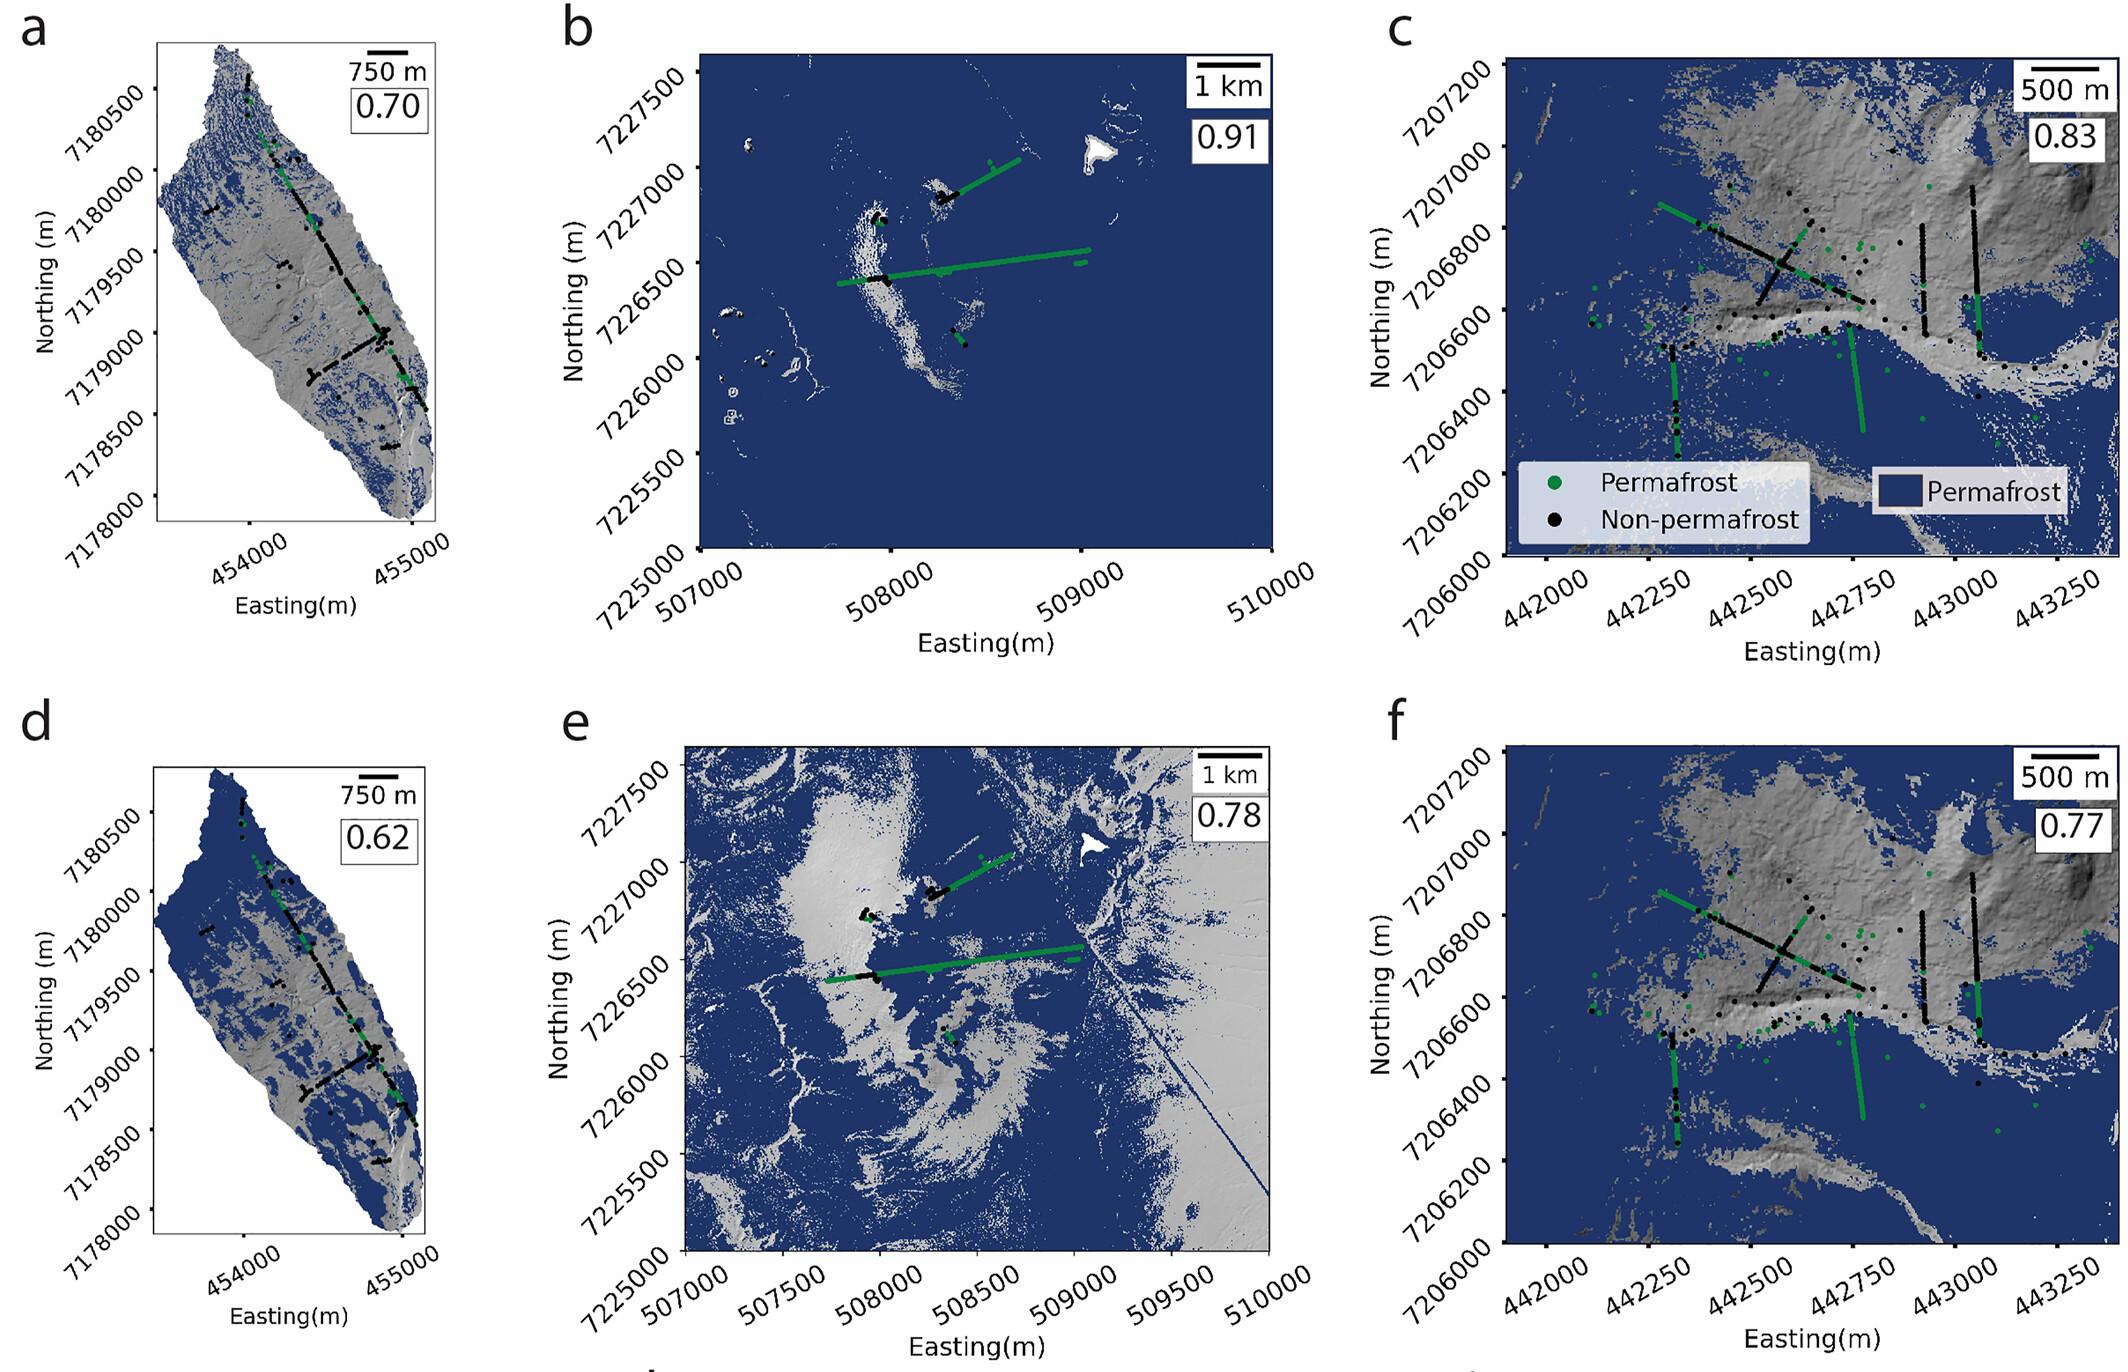
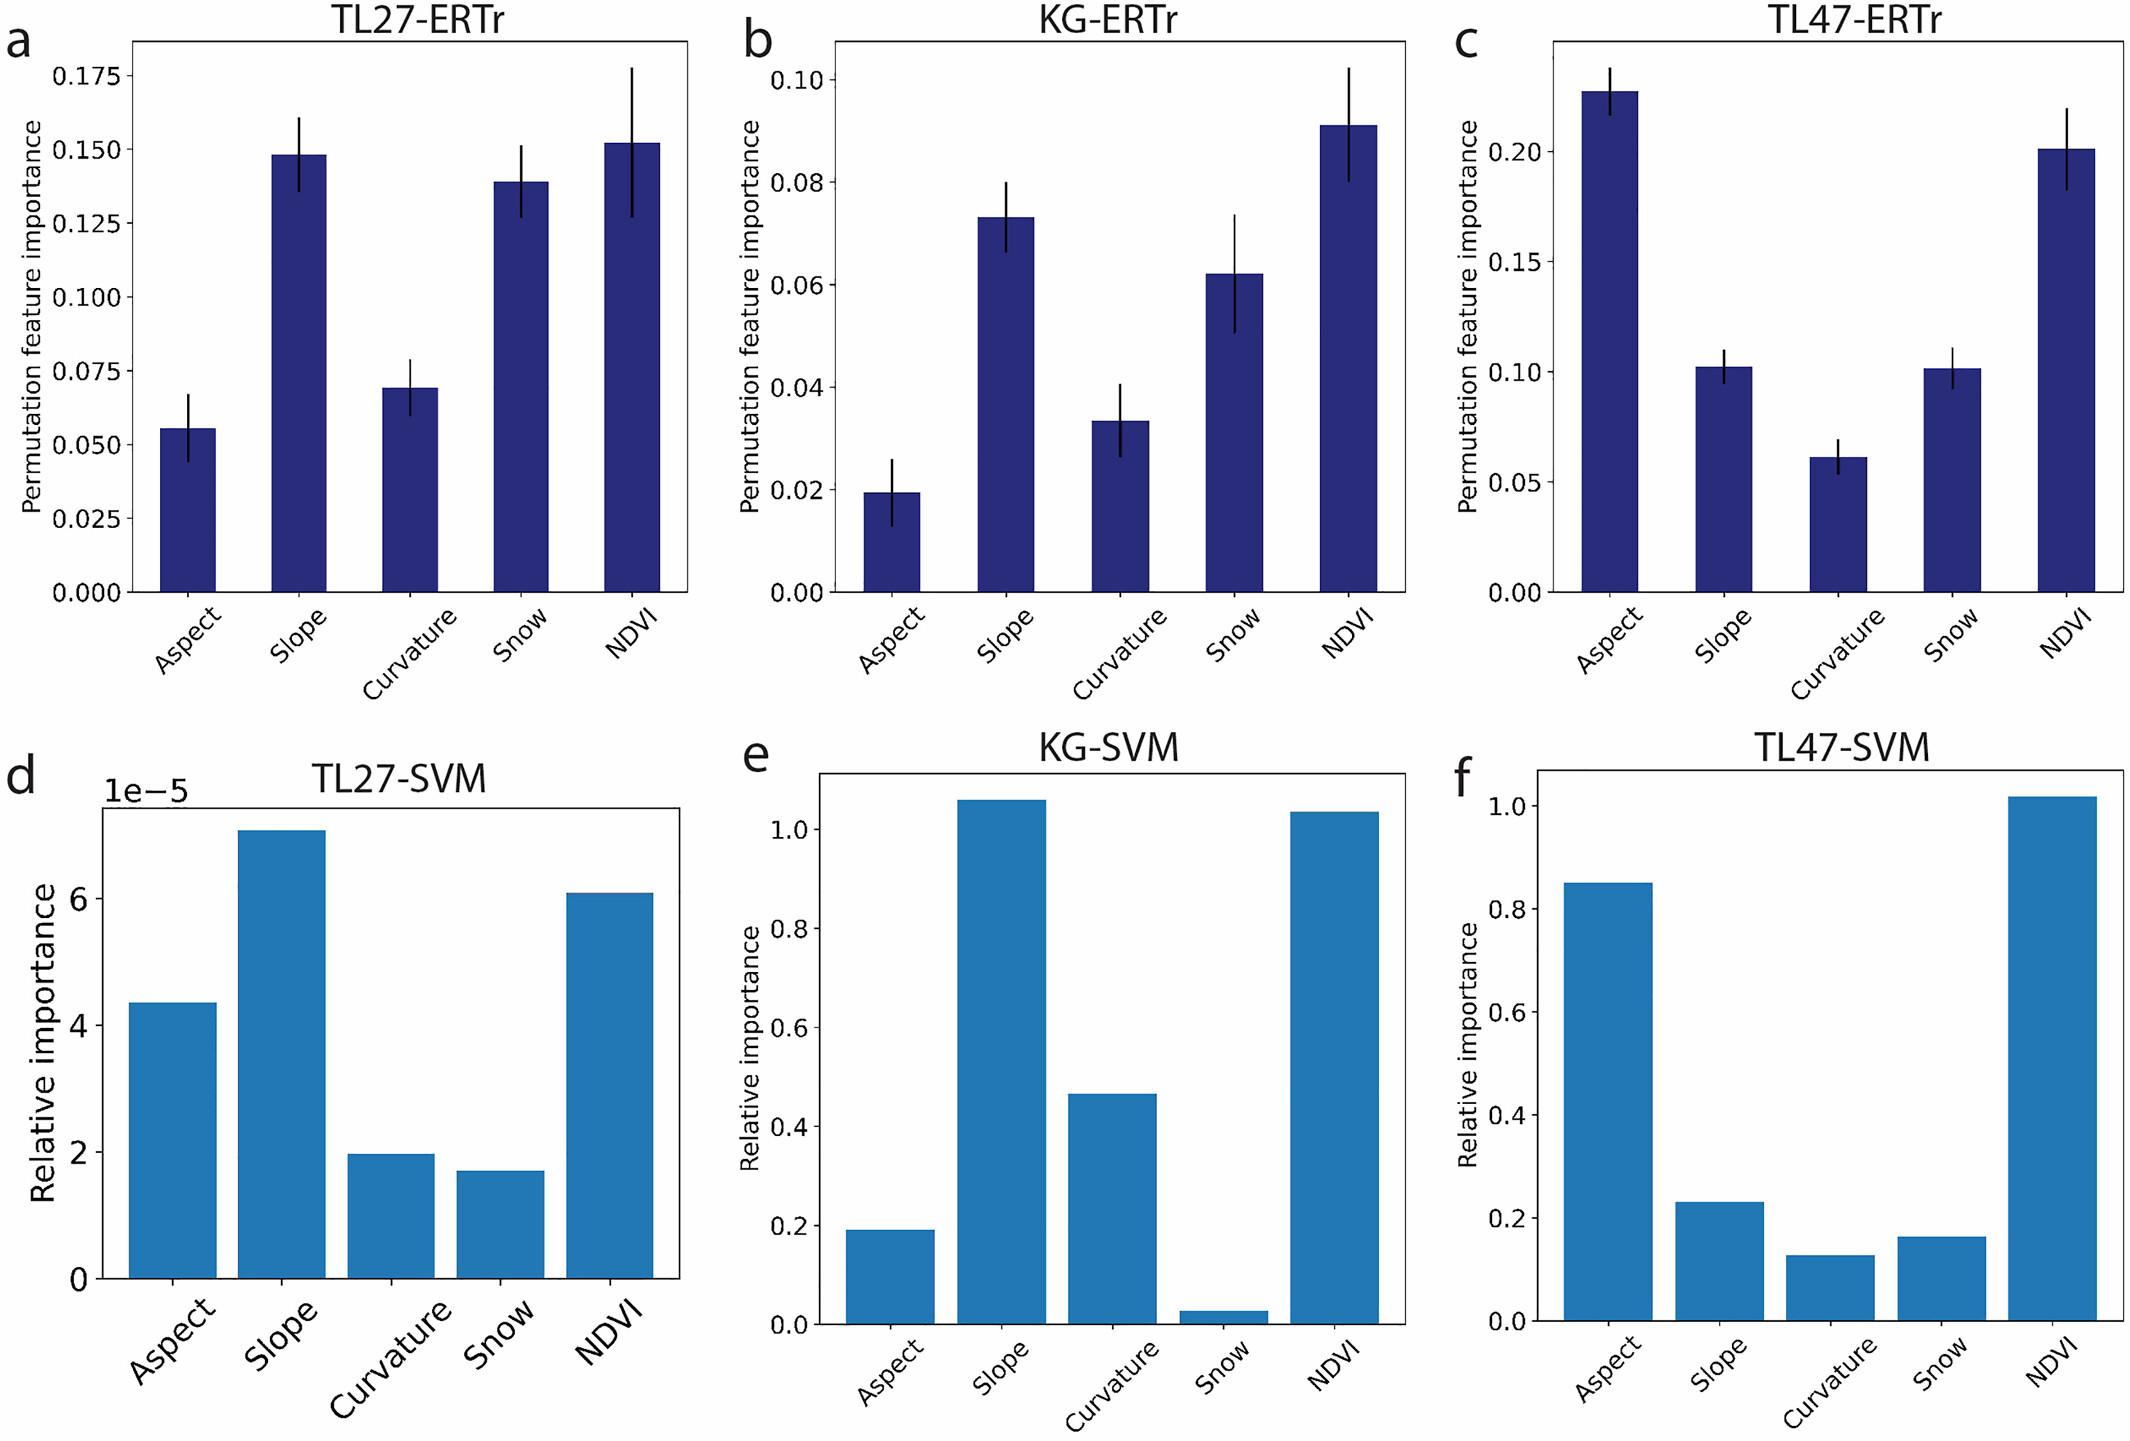
We wanted to test how well different machine learning architectures (models) can be trained to make maps of near-surface permafrost extent. For ground truth data, we used some geophysical measurements and other observations like soil pits and frost probes. We used lidar point clouds to make models of the vegetation height across the landscape, digital elevation models, and several topographic metrics for each of the sites. We also used high-resolution satellite imagery to map out the vegetation greenness using a metric called the normalized difference vegetation index (NDVI) and also used our Blue Snow Threshold to make an estimate of snow-cover duration for every pixel across the study sites. We used all of those remote sensing data and the ground truth observations to train a random forest model (ERTr), a support vector machine model (SVM), and an artificial neural network model. We also wanted to know how well a model trained at one site can predict permafrost extent at a site the model hasn't seen before (this is model transferability). Since we have three sites, we tested transferability by training the model on a combination of two sites and then testing that trained model on the third site.
How well did the models do?
The random forest models did the best job at predicting permafrost extent for sites that the model had seen (what we call at-a-site prediction), with accuracies up to 83%. But, those models didn't transfer that well to sites it hadn't seen. The support vector machines were the better performing architecture for the transferred models, getting accuracies up to 78%. Turns out, with the right set of features and enough ground truth training data, machine learning does pretty darn well at mapping near-surface permafrost.
Which features are the most important to have for prediction?
A very cool aspect of machine learning is learning which of the features (in this case remote sensing variables) are really driving the prediction. We call these the important features. At these sites, NDVI is consistently one of the most important features, probably because plants are sensitive to the soil conditions and are a good indicator of frozen versus unfrozen soil. If you want to dig deeper into how we built and interpret these models, check out the paper published in Earth and Space Science (Thaler et al., 2023).